
About this case study
This scenario models a reporting workflow. Amplispect surfaces provider data but does not automatically change bids, budgets, targeting, or campaign settings.
The reporting problem
A growth lead runs paid campaigns on Meta, TikTok, and Google Ads. The weekly review starts with three browser tabs, three date pickers, and a spreadsheet that is already stale by the time the meeting begins.
The team does not need another attribution promise. It needs a consistent first pass over provider-reported spend and delivery so it can identify where to investigate next.
In this scenario, the growth lead connects the three marketing sources, selects the last 30 days, and uses Amplispect as the shared review surface before opening a provider for deeper diagnosis or changes.
The 30-minute review agenda
A focused meeting can move from portfolio to exception:
- Refresh the selected date range and note any provider sync errors before trusting the totals.
- Compare spend, impressions, clicks, CTR, CPC, CPM, conversions, and ROAS using the same visible window.
- Inspect the daily trend for sudden delivery, cost, or conversion changes that an aggregate total might hide.
- Filter by provider or account, then sort campaign rows to find the largest spend and weakest efficiency signals.
- Write down the campaigns that need provider-level investigation; make budget or targeting changes only after checking their native context.
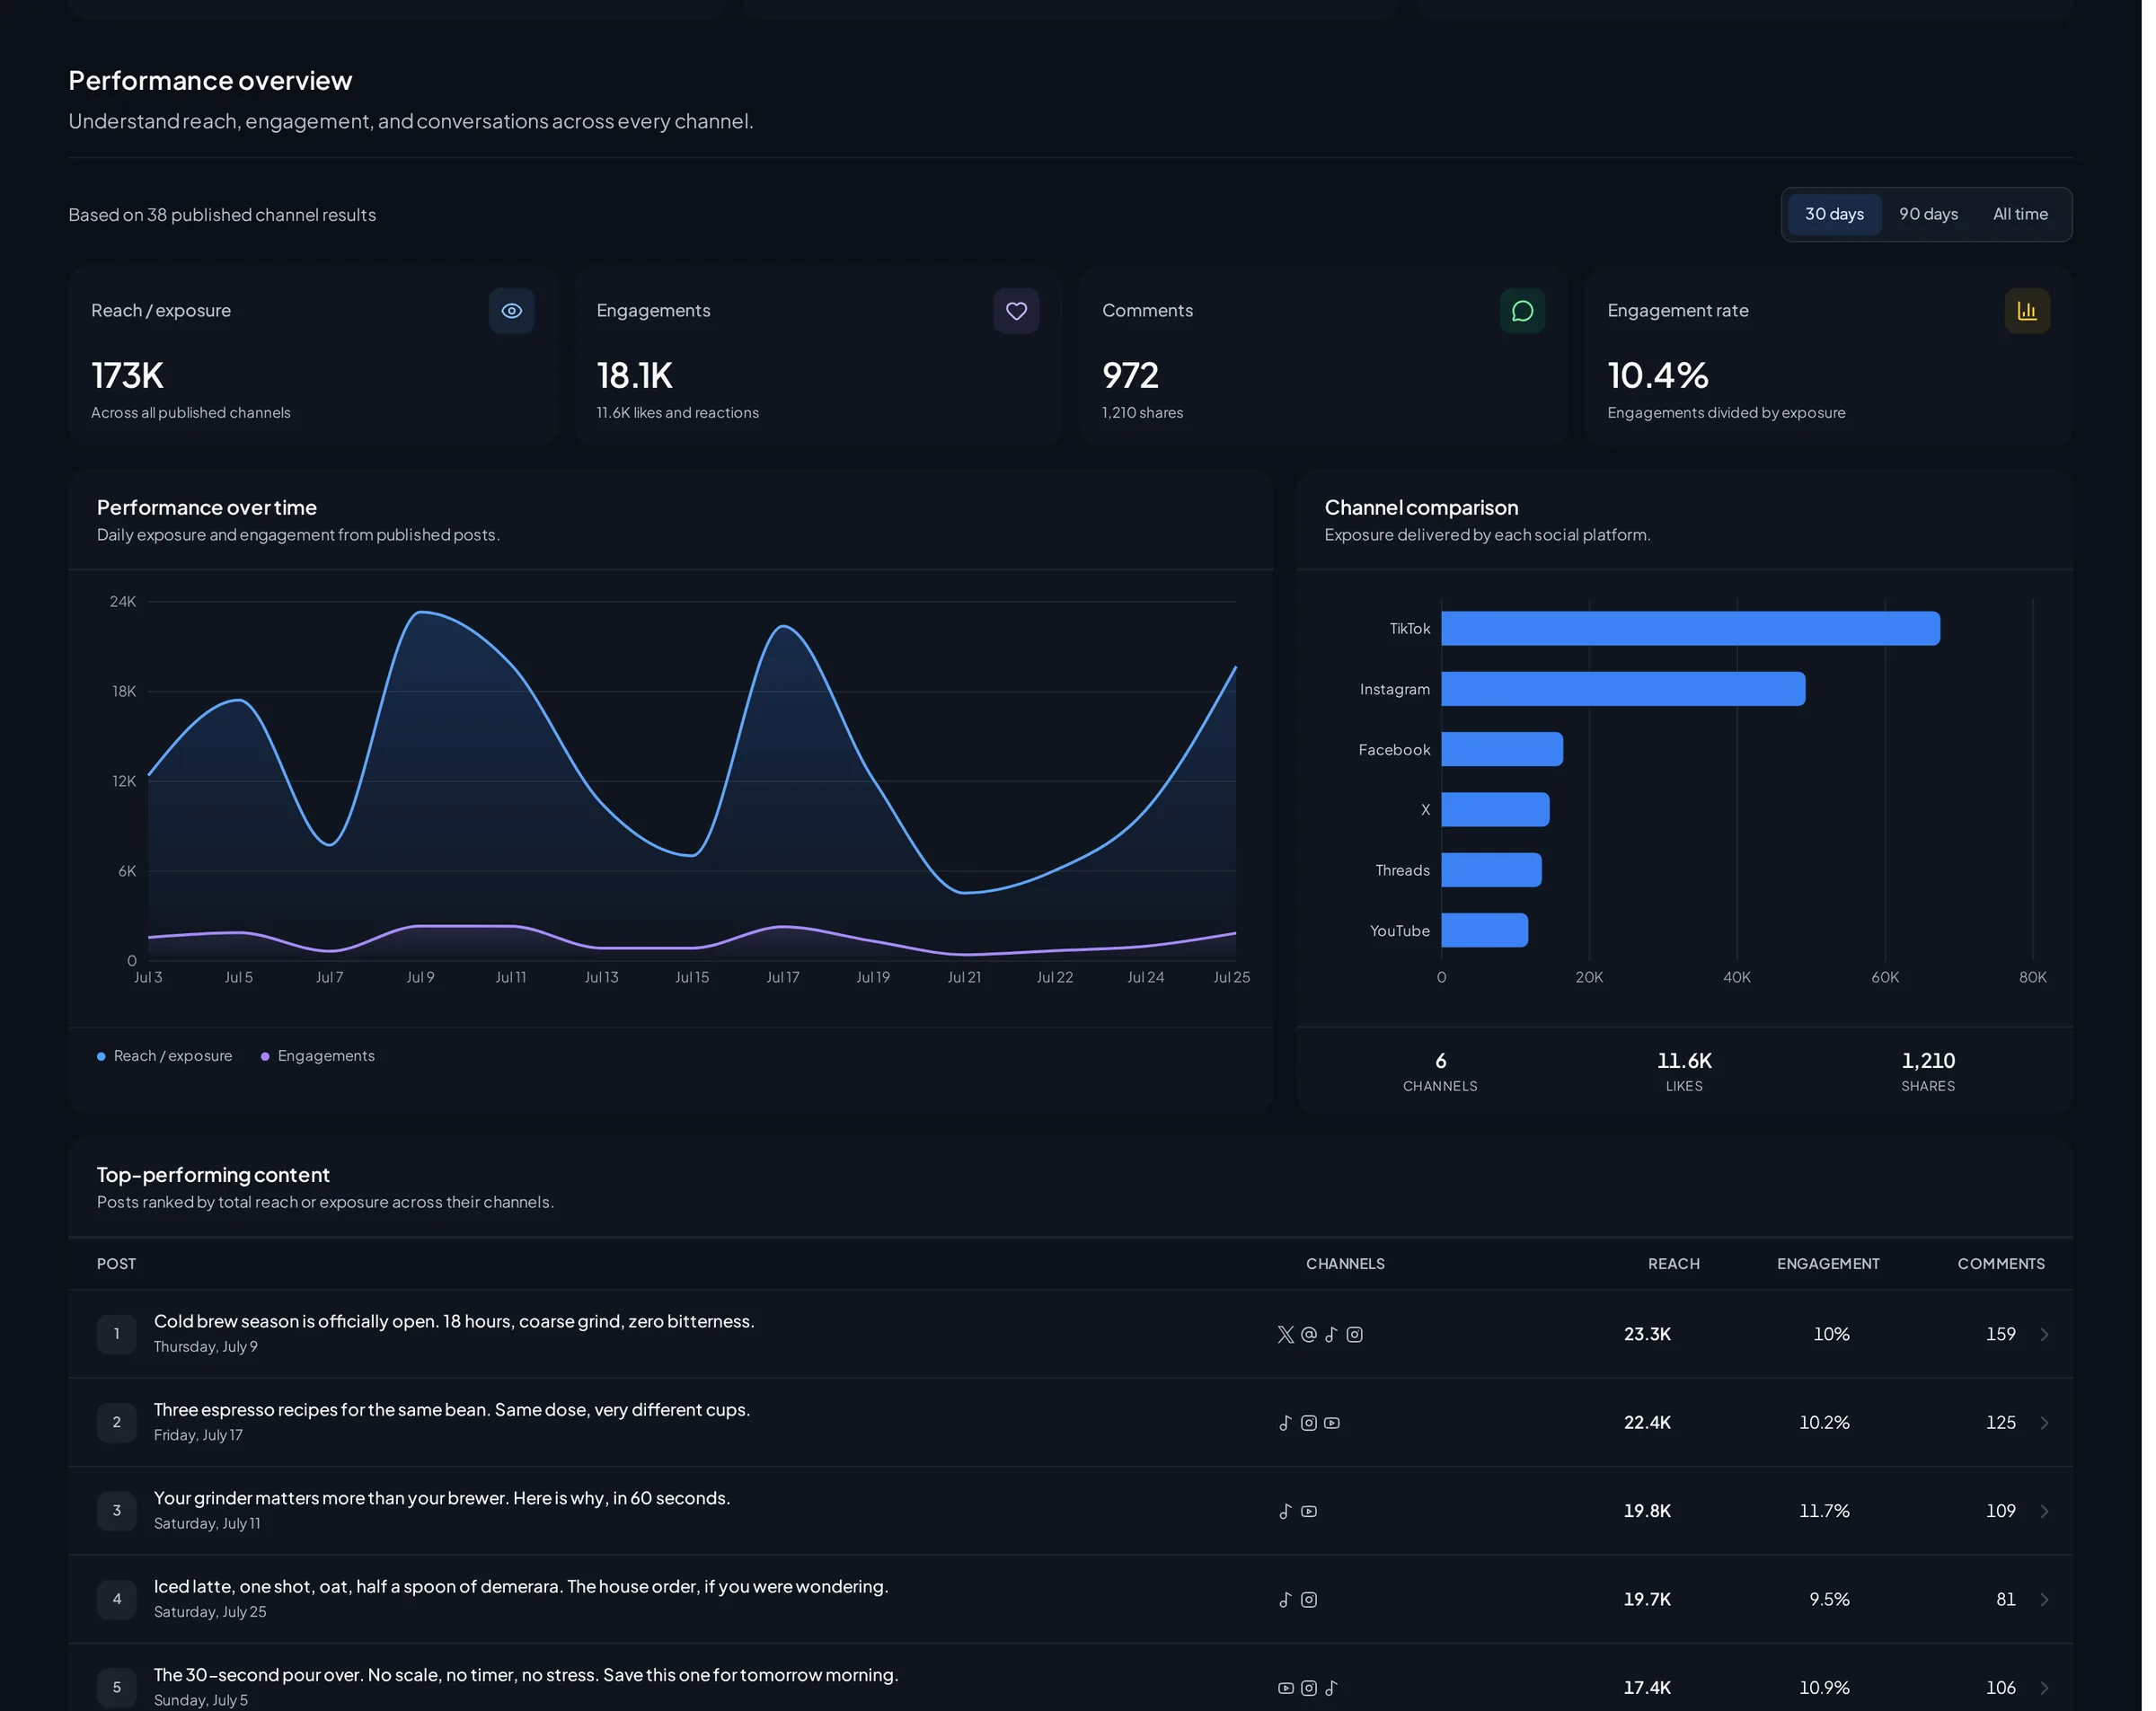
How the review improves decision quality
A shared overview helps the meeting start with the same numbers. The team can spend less time reconciling screenshots and more time asking why a metric moved.
The daily chart also makes timing visible. A weak 30-day average may hide a campaign that improved last week, while a strong total may hide a recent cost spike.
The overview is a triage layer, not a complete attribution model. Conversion definitions, attribution windows, currencies, and delayed reporting can differ by provider. Those differences need to be understood before money moves.
The modeled operational outcome
The team can begin its weekly review with one refreshed date range and a ranked list of exceptions instead of three manual exports. The meeting becomes faster to prepare, while final media decisions remain deliberate.
The analytics guardrail
Cross-platform columns can look comparable while their underlying attribution rules differ. Treat the dashboard as provider-reported operational data, then verify material decisions in the source platform.
Frequently asked questions
Which paid platforms are included in this workflow?
The current ads metrics view supports connected Meta, TikTok, and Google Ads accounts.
Which metrics can the team compare?
The view includes spend, impressions, clicks, CTR, CPC, CPM, conversions, ROAS, daily trends, and campaign-level rows when the provider returns those fields.
Can Amplispect reallocate the budget?
No. The dashboard helps the team identify where to investigate. Bid, budget, targeting, and campaign changes remain deliberate actions in the relevant ad platform.